Last week, I attended a PLC academy in my district. The focus of this day was how do we know when students have learned. So naturally, the discussion was around the topic of assessment. There were many good assessment discussions happening...formative vs. summative, exit slips, etc. As the day was winding down, the discussion moved to how students can play a bigger role and take more responsibility for their learning. Students should be setting their own learning goals based on assessment data but how can they do this?
One of my schools created a drawing of how they would like students to track their assessment scores in math. Their ideas was to break the assessment into the 6 focus areas and have the students record how they did in each focus area. From there, the students could write goals based on their data. I suggested that Excel to track and display the data. Within Excel, I think two different methods could be successful.
The first method is to setup a table and graph ahead of time in Excel. The students would each have their own copy of this file. After each assessment, the students can enter their scores into the table. The graph will automatically update (when creating the graph, I highlighted all the cell in the chart and this is how it automatically updates) and the students can see their progress in each area. From there, students can write their goals based on real data.
 |
Using Excel to Graph Data
|
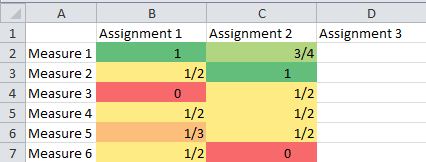
The other method is to use color coding and not use a graph. In this example, I setup three categories for the color (0% = red, 50%= yellow, 100%= green). The students would enter their scores and the cells would automatically turn to the appropriate color. If a score was not one of the three listed above, then the cell would be a shade of the closest color (75% turns the cell into a lighter shade of green). After entering scores, students could see which areas are in the red and yellow and write their goals accordingly.
 |
| Using Color Coding in Excel |
No matter how you are tracking data, get the students involved. Students will become more invested in the process and that should hopefully lead to more learning and achievement. This is just one strategy teachers can use to get students more actively engaged in their learning.
Here is a link to the
Excel spreadsheet. Hope you find it helpful.

No comments:
Post a Comment