I received some good news recently...I had some conference proposals accepted! Anybody who knows me personally understands that I am an introvert. You would think that speaking at a conference and my personality type would not match up but that could not be further from the truth. I thoroughly enjoy speaking to groups, sharing my knowledge and experiences, and participating in a good discussion. There is something energizing about speaking to a group and thus I am excited for the opportunity to do this again this year.
As I have for the past six or seven years, I will be presenting at the Midwest Education Technology Conference (METC) in St. Charles, MO. This is a wonderful conference to attend and the audiences are always receptive to what the presenters have to say. Looking at the sessions for this year, I am excited to attend many sessions and continue my learning journey. I assume most of the conference participants are excited too. They are excited because as fellow users of technology, they see the value that integrating technology has on student learning. As much as having a receptive and supportive audience is great, that is also the problem with technology conferences. We have a large segment of our teachers who are not attending and not hearing our message of technology integration. These teachers could really benefit from attending a conference that is out of their comfort zone. So when I am presenting at METC, am I preaching to the choir? How do we get some new participants to these conferences? How do we share all the ideas, conversations, and resources from the conference to those not attending?
With these questions in mind, I did something different this year. I sent a proposal to a non-technology conference and it was accepted. In March, I will be presenting at the Show-Me Staff Development Conference in Columbia, Missouri. My session is title "Non-Traditional Staff Development in the Digital World". I will be talking with teachers and staff developers about building a PLN through online resources and curating these resources for individualized professional development. I am pretty sure that my session will be different than most of the other sessions, and it is my hope that I can provide a fresh perspective to a new audience. By presenting in a different setting to a different crowd, I will not be preaching to the choir. It is my goal that some of my participants will start their online learning journey after leaving my session. This is my chance to spread the word to a new audience!
This infographic shows how educators are using social media and the work that needs to be done in this area. With this in mind, I find it important to spread the word about the value of technology integration for classroom and professional learning. Presenting at different conferences and bringing new participants to technology conferences is just the beginning. Let's reach out to a new audience and provide a new voice.
What strategies can we use to reach our teaching staff?
Tuesday, November 27, 2012
Monday, November 19, 2012
Easy Exit Slip Assessment Using Technology
As all of us in the education world know, assessment of student learning is all the buzz. Standardized testing, benchmark testing, and the list goes on and on. For teachers, these types of tests may not contain the data and information they need to make the day to day instructional decisions. The formative assessments that are teacher created seem to have more valuable and immediate impact. One of these formative assessments is the exit slip. For years, teachers have been effectively using exit slips to monitor student learning. They are quick, easy and to the point. The problem with exit slips is the ability to quickly see data trends and to track the results over multiple exit slips. Technology resources can make the exit slip ever more powerful and effective than it is already. In my opinion, the two easiest ways to incorporate technology for exit slips is to use a Google Form or Socrative. After some thought, here is my suggestion on how to use these two resources in the easiest way possible.
Google Form
The first step is to create a generic Google Form. Once you have created a generic form, post a link to it or embed it on your website. Here is an example.
When creating my generic exit slip, the first question asked for the student's name. The other four questions are all text response boxes. By using text response boxes, I can use any type of question. Students can answer with a letter, number, sentence, paragraph, etc. This gives me the freedom to ask any type of question on my exit assessment. By making one generic form, I can use it over and over again.
But how can I use this if my classroom is not a 1:1 environment? Because the form is simply a place to enter the answers, students could answer the questions in a notebook and then transfer their answers to the form when they are done. Students can also enter their answers on their phones (if allowed) or from home because this exit slip is online.
When the students submit their answers, all of the data is collected in a spreadsheet. With all of the answers organized together, the teacher can quickly analyze the data and see if the students understood the concept. Teachers can also quickly see which students need further assistance. When teachers are finished with the data, they can erase it and reuse the form. The data can also be exported Excel if the teacher wants keep the data for further use. By not having to create new forms every time, hopefully this will save teachers time!
Socrative
Another option for using technology to administer exit slip assessments is Socrative. This free, online resource allows teachers to administer assessments through a web interface or with the Socrative student app. After setting up your free account, create a generic exit slip assessment just like in the example above. With Socrative, the first question (the student's name) is automatically created. The teacher needs to only create the generic short answer questions. Once created, this same assessment can be used over and over again saving teachers time!
When it is time to administer the exit slip assessment, the teacher will log into Socrative via the web or through the teacher app. In the quiz based activites section, the teacher will select "Start a Quiz". Socrative does have an exit ticket created but you cannot edit this quiz so I suggest making your own.
After clicking "Start Quiz", select the quiz you would like and then administer it as a student paced quiz. Your exit slip assessment is ready to go.
Students will go to Socrative via the web or the student app. The students will be prompted to enter a room number. When your teacher account is created, you are given one room number that is used for all assessments given with Socrative. Students will now enter the answers to their exit slip assessment. When finished with a question, the students click submit and then will be moved onto the next question.
After answering all the questions, students select finish quiz. If students are sharing computers, they can click "Let another student take the quiz". This feature is good for classrooms that are not a 1:1 environment.
Once the assessment is completed, the teacher can close the quiz and have the results emailed to them or the results can be downloaded into Excel immediately. Teachers can quickly analyze the data for trends and to see which students need further instruction.

Both of these resources could make using exit slips and analyzing the data easier for teachers. Give it a try and let me know what you think.
Google Form
The first step is to create a generic Google Form. Once you have created a generic form, post a link to it or embed it on your website. Here is an example.
When creating my generic exit slip, the first question asked for the student's name. The other four questions are all text response boxes. By using text response boxes, I can use any type of question. Students can answer with a letter, number, sentence, paragraph, etc. This gives me the freedom to ask any type of question on my exit assessment. By making one generic form, I can use it over and over again.
But how can I use this if my classroom is not a 1:1 environment? Because the form is simply a place to enter the answers, students could answer the questions in a notebook and then transfer their answers to the form when they are done. Students can also enter their answers on their phones (if allowed) or from home because this exit slip is online.
When the students submit their answers, all of the data is collected in a spreadsheet. With all of the answers organized together, the teacher can quickly analyze the data and see if the students understood the concept. Teachers can also quickly see which students need further assistance. When teachers are finished with the data, they can erase it and reuse the form. The data can also be exported Excel if the teacher wants keep the data for further use. By not having to create new forms every time, hopefully this will save teachers time!
 |
| Exit slip data feeds into a Google spreadsheet |
Socrative
Another option for using technology to administer exit slip assessments is Socrative. This free, online resource allows teachers to administer assessments through a web interface or with the Socrative student app. After setting up your free account, create a generic exit slip assessment just like in the example above. With Socrative, the first question (the student's name) is automatically created. The teacher needs to only create the generic short answer questions. Once created, this same assessment can be used over and over again saving teachers time!
When it is time to administer the exit slip assessment, the teacher will log into Socrative via the web or through the teacher app. In the quiz based activites section, the teacher will select "Start a Quiz". Socrative does have an exit ticket created but you cannot edit this quiz so I suggest making your own.
 |
| Click Start Quiz |
Students will go to Socrative via the web or the student app. The students will be prompted to enter a room number. When your teacher account is created, you are given one room number that is used for all assessments given with Socrative. Students will now enter the answers to their exit slip assessment. When finished with a question, the students click submit and then will be moved onto the next question.
 |
| Socrative student interface |
 |
| Completed Assessment |

Both of these resources could make using exit slips and analyzing the data easier for teachers. Give it a try and let me know what you think.
Saturday, November 17, 2012
Wednesday, November 14, 2012
It's Time to Connect
The theme of connecting has been prominent in my work recently. As a district, we rolled out Microsoft Lync to all staff. With Lync, staff are able to connect and collaborate with voice, video, chat, and desktop sharing. As I began meeting with teachers about using Lync, some interesting conversations began to happen. Ideas for collaborating and connecting classrooms were stretching people's thinking. I look forward to see how Lync will be used to connect in my district.
Yesterday, I participated in a great #edchat about grading and report cards. This is a topic that is being discussed in my district now so the timing could not have been better. It was great to have a Twitter discussion and get viewpoints of others outside of my district. Fresh perspectives and new connections add to my knowledge and thinking.
Last night, I conducted a Personal Learning Networks session. This was the first time that this topic has been formally presented in an official district workshop. Being connected is something I find so important to my work and I only hope I was able to deliver the message about being a connected educator.
All of this has me thinking about how connected or unconnected we are in my district. How do I deliver the message that being connected adds to professional growth? It seems that taking the first step is terrifying...like we are stepping off a cliff into thin air. There is the fear of failure and the unknown. How do we help educators take that first step into the connected world?
For that answer, I will go to my connected world.
Thoughts?
Saturday, November 10, 2012
Wednesday, November 7, 2012
Student Goal Setting and Data Tracking with Excel
Last week, I attended a PLC academy in my district. The focus of this day was how do we know when students have learned. So naturally, the discussion was around the topic of assessment. There were many good assessment discussions happening...formative vs. summative, exit slips, etc. As the day was winding down, the discussion moved to how students can play a bigger role and take more responsibility for their learning. Students should be setting their own learning goals based on assessment data but how can they do this?
One of my schools created a drawing of how they would like students to track their assessment scores in math. Their ideas was to break the assessment into the 6 focus areas and have the students record how they did in each focus area. From there, the students could write goals based on their data. I suggested that Excel to track and display the data. Within Excel, I think two different methods could be successful.
The first method is to setup a table and graph ahead of time in Excel. The students would each have their own copy of this file. After each assessment, the students can enter their scores into the table. The graph will automatically update (when creating the graph, I highlighted all the cell in the chart and this is how it automatically updates) and the students can see their progress in each area. From there, students can write their goals based on real data.
The other method is to use color coding and not use a graph. In this example, I setup three categories for the color (0% = red, 50%= yellow, 100%= green). The students would enter their scores and the cells would automatically turn to the appropriate color. If a score was not one of the three listed above, then the cell would be a shade of the closest color (75% turns the cell into a lighter shade of green). After entering scores, students could see which areas are in the red and yellow and write their goals accordingly.
No matter how you are tracking data, get the students involved. Students will become more invested in the process and that should hopefully lead to more learning and achievement. This is just one strategy teachers can use to get students more actively engaged in their learning.
Here is a link to the Excel spreadsheet. Hope you find it helpful.
One of my schools created a drawing of how they would like students to track their assessment scores in math. Their ideas was to break the assessment into the 6 focus areas and have the students record how they did in each focus area. From there, the students could write goals based on their data. I suggested that Excel to track and display the data. Within Excel, I think two different methods could be successful.
The first method is to setup a table and graph ahead of time in Excel. The students would each have their own copy of this file. After each assessment, the students can enter their scores into the table. The graph will automatically update (when creating the graph, I highlighted all the cell in the chart and this is how it automatically updates) and the students can see their progress in each area. From there, students can write their goals based on real data.
 |
| Using Excel to Graph Data |
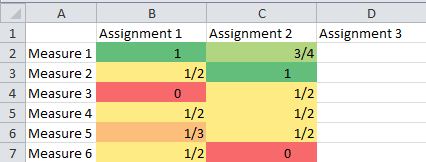 |
| Using Color Coding in Excel |
Here is a link to the Excel spreadsheet. Hope you find it helpful.
Subscribe to:
Posts (Atom)